Custom pages
Most Admin Panels should have some Dashboards or custom pages.
In AdminForth creation of custom page is very simple.
Create a Vue component in the custom directory of your project, e.g. Dashboard.vue:
<template>
  <div class="px-4 py-4 bg-blue-50 dark:bg-gray-900 dark:shadow-none min-h-screen">

    <div class="grid grid-cols-1 md:grid-cols-2 lg:grid-cols-3 xl:grid-cols-4 gap-4">
      <div class="w-full bg-white rounded-lg shadow dark:bg-gray-800 p-4 md:p-5 min-h-[340px]" v-if="data">
        <div class="mb-2">
          <h5 class="leading-none text-3xl font-bold text-gray-900 dark:text-white pb-2">{{ data.totalAparts }}</h5>
          <p class="text-base font-normal text-gray-500 dark:text-gray-400">{{  $t('Apartment last 7 days | Apartments last 7 days', data.totalAparts) }}</p>
        </div>
        <BarChart
          :data="apartsCountsByDaysChart"
          :series="[{
            name: $t('Added apartments'),
            fieldName: 'count',
            color: COLORS[0],
          }]"
          :options="{
            chart: {
              height: 180,
            },
            yaxis: {
              stepSize: 1,
              labels: { show: false },
            },
            grid: {
              show: false,
            }
          }"
        />
      </div>

      <div class="w-full bg-white rounded-lg shadow dark:bg-gray-800 p-4 md:p-5 min-h-[340px]" v-if="data">
        <p class="text-base font-normal text-gray-500 dark:text-gray-400 mb-3 text-center">
          {{ $t('Top countries') }}
        </p>

        <div class="flex justify-center items-center">
        <PieChart
          :data="topCountries"
          :options="{
            chart: { type: 'pie', height: 300 },
            legend: {
              show: false,
            },
            dataLabels: {
              enabled: true,
              formatter: function (value, o) {
                const countryISO = o.w.config.labels[o.seriesIndex];
                return countryISO;
              }
            },
          }"
        />
      </div>
      </div>

      <div class="w-full bg-white rounded-lg shadow dark:bg-gray-800 p-4 md:p-5 lg:row-span-2 xl:col-span-2 min-h-[700px]" v-if="data">
        <div class="grid grid-cols-2 py-3 gap-4 text-center">
          <dl>
            <dt class="text-base font-normal text-gray-500 dark:text-gray-400 pb-1">
              {{ $t('Listed price') }}
            </dt>
            <dd class="leading-none text-xl font-bold" :style="{color:COLORS[0]}">
              {{
              new Intl.NumberFormat('en-US', { style: 'currency', currency: 'USD', maximumFractionDigits: 0, }).format(
                data.totalListedPrice,
              ) }}
            </dd>
          </dl>
          <dl>
            <dt class="text-base font-normal text-gray-500 dark:text-gray-400 pb-1">
              {{ $t('Unlisted price') }}</dt>
            <dd class="leading-none text-xl font-bold" :style="{color:COLORS[1]}">
            {{
              new Intl.NumberFormat('en-US', { style: 'currency', currency: 'USD', maximumFractionDigits: 0, }).format(
                data.totalUnlistedPrice,
              ) }}
            </dd>
          </dl>
        </div>

        <BarChart
          :data="listedVsUnlistedCountByDays"
          :series="[{
            name: $t('Listed Count'),
            fieldName: 'listed',
            color: COLORS[0],
          },
          {
            name: $t('Unlisted Count'),
            fieldName: 'unlisted',
            color: COLORS[1],
          }]"
          :options="{
            chart: {
              height: 600,
            },
            xaxis: {
              labels: { show: true },
              stepSize: 1,  // since count is integer, otherwise axis will be float
            },
            yaxis: {
              labels: { show: true }
            },
            grid: {
              show: true,
            },
            plotOptions: {
              bar: {
                horizontal: true, // by default bars are vertical
              }
            },
          }"
        />

      </div>

      <div class="w-full bg-white rounded-lg shadow dark:bg-gray-800 p-4 md:p-5 min-h-[340px]" v-if="data">
        <p class="text-base font-normal text-gray-500 dark:text-gray-400 mb-3 text-center">{{ $t('Apartment by rooms') }}</p>
        <div class="flex justify-center items-center">
        <PieChart
          :data="apartsCountsByRooms"
          :options="{
            chart: { type: 'donut', height: 300 },
            plotOptions: {
              pie: {
                donut: {
                  labels: {
                    total: {
                      show: true,
                      label: $t('Total square'),
                      formatter: () => `${data.totalSquareMeters.toFixed(0)} m²`,
                    },
                  },
                },
              },
            },
          }"
        />
      </div>
      </div>

      <div class="w-full bg-white rounded-lg shadow dark:bg-gray-800 p-4 md:p-5 min-h-[340px]" v-if="data">
        <p class="text-base font-normal text-gray-500 dark:text-gray-400 mb-3 text-center">{{ $t('Unlisted vs Listed price' ) }}</p>

        <AreaChart
          :data="listedVsUnlistedPriceByDays"
          :series="[{
            name: $t('Listed'),
            fieldName: 'listedPrice',
            color: COLORS[0],
          },
          {
            name: $t('Unlisted'),
            fieldName: 'unlistedPrice',
            color: COLORS[1],
          }]"
          :options="{
            chart: {
              height: 320,
            },
            yaxis: {
              labels: {
                formatter: function (value) {
                  return '$' + value;
                }
              }
            },
          }"
        />
      </div>

    </div>
  </div>
</template>

<script setup lang="ts">
import { ref, type Ref, onMounted, computed } from 'vue';
import dayjs from 'dayjs';
import { callApi } from '@/utils';
import { useI18n } from 'vue-i18n';
import { useAdminforth } from '@/adminforth';
import { AreaChart, BarChart, PieChart } from '@/afcl';

const data: Ref<{listedVsUnlistedPriceByDays: any, listedVsUnlistedByDays: any,
  apartsByDays: any, apartsCountsByRooms: any, topCountries: any, totalAparts: any} | null> = ref(null);

const { t } = useI18n();

const { alert } = useAdminforth();

const COLORS = ["#4E79A7", "#F28E2B", "#E15759", "#76B7B2", "#59A14F"]

const apartsCountsByDaysChart = computed(() => {
  return data.value.apartsByDays?.reverse().map(
    (item) => ({
      x: dayjs(item.day).format('DD MMM'),
      count: item.count
    })
  );
});

const listedVsUnlistedPriceByDays = computed(() => {
  return data.value.listedVsUnlistedPriceByDays?.map(
    (item) => ({
      x: dayjs(item.day).format('DD MMM'),
      listedPrice: item.listedPrice.toFixed(2),
      unlistedPrice: item.unlistedPrice.toFixed(2),
    })
  );
});

const listedVsUnlistedCountByDays = computed(() => {
  return data.value.listedVsUnlistedByDays?.map(
    (item) => ({
      x: dayjs(item.day).format('DD MMM'),
      listed: item.listed,
      unlisted: item.unlisted,
    })
  );
});

const apartsCountsByRooms = computed(() => {
  return data.value.apartsCountsByRooms?.map(
    (item, i) => ({
      label: t(`{number_of_rooms} rooms`, { number_of_rooms: item.number_of_rooms }),
      amount: item.count,
      color: COLORS[i],
    })
  );
});

const topCountries = computed(() => {
  return data.value.topCountries?.map(
    (item, i) => ({
      label: item.country,
      amount: item.count,
      color: COLORS[i],
    })
  );
});

onMounted(async () => {
  // Fetch data from the API
  try {
    data.value = await callApi({path: '/api/dashboard/', method: 'GET'});
  } catch (error) {
    alert({
      message: t(`Error fetching data: {message}`, { message: error.message }),
      variant: 'danger',
    });
  }
})
</script>
☝️ use https://flowbite.com/ to get pre-designed tailwind design blocks for your pages
Now let's add this page to the AdminForth menu and make it homepage instead of Apartments page:
menu: [
    {
      label: 'Dashboard',
      path: '/overview',
      homepage: true,
      icon: 'flowbite:chart-pie-solid',
      component: '@@/Dashboard.vue',
    },
    {
      label: 'Core',
      icon: 'flowbite:brain-solid',
      open: true,
      children: [
        {
          homepage: true,
          label: 'Apartments',
          icon: 'flowbite:home-solid',
          resourceId: 'aparts',
        },
      ]
    },
☝️ To find icon go to https://icon-sets.iconify.design/flowbite/?query=chart, click on icon you like and copy name:
You might notice that in mounted hook page fetches custom endpoint '/api/dashboard-stats'. Now we have to define this endpoint in the backend to make our page work:
Defining custom API for own page and components
Open api.ts file and add the following code BEFORE admin.express.authorize !
import type { IAdminUserExpressRequest } from 'adminforth';
import express from 'express';
import * as z from 'zod';

....

app.get(`${ADMIN_BASE_URL}/api/dashboard/`,
  admin.express.withSchema(
    {
      description: 'Returns aggregated apartment metrics for the custom dashboard page.',
      response: z.object({
        apartsByDays: z.array(z.record(z.string(), z.unknown())),
        totalAparts: z.number(),
      }).catchall(z.unknown()),
    },
    admin.express.authorize(
      async (req:IAdminUserExpressRequest, res: express.Response) => {
      const days = req.body.days || 7;
      const apartsByDays = admin.resource('aparts').dataConnector.client.prepare(
        `SELECT
          strftime('%Y-%m-%d', created_at) as day,
          COUNT(*) as count
        FROM apartments
        GROUP BY day
        ORDER BY day DESC
        LIMIT ?;
        `
      ).all(days);

      const totalAparts = apartsByDays.reduce((acc: number, { count }: { count:number }) => acc + count, 0);

      // add listed, unlisted, listedPrice, unlistedPrice
      const listedVsUnlistedByDays = admin.resource('aparts').dataConnector.client.prepare(
        `SELECT
          strftime('%Y-%m-%d', created_at) as day,
          SUM(listed) as listed,
          COUNT(*) - SUM(listed) as unlisted,
          SUM(listed * price) as listedPrice,
          SUM((1 - listed) * price) as unlistedPrice
        FROM apartments
        GROUP BY day
        ORDER BY day DESC
        LIMIT ?;
        `
      ).all(days);

      const apartsCountsByRooms = await admin.resource('aparts').dataConnector.client.prepare(
        `SELECT
          number_of_rooms,
          COUNT(*) as count
        FROM apartments
        GROUP BY number_of_rooms
        ORDER BY number_of_rooms;
        `
      ).all();

      const topCountries = await admin.resource('aparts').dataConnector.client.prepare(
        `SELECT
          country,
          COUNT(*) as count
        FROM apartments
        GROUP BY country
        ORDER BY count DESC
        LIMIT 4;
        `
      ).all();

      const totalSquare = admin.resource('aparts').dataConnector.client.prepare(
        `SELECT
          SUM(square_meter) as totalSquare
        FROM apartments;
        `
      ).get();

      const listedVsUnlistedPriceByDays = admin.resource('aparts').dataConnector.client.prepare(
        `SELECT
          strftime('%Y-%m-%d', created_at) as day,
          SUM(listed * price) as listedPrice,
          SUM((1 - listed) * price) as unlistedPrice
        FROM apartments
        GROUP BY day
        ORDER BY day DESC
        LIMIT ?;
        `
      ).all(days);

      const totalListedPrice = Math.round(listedVsUnlistedByDays.reduce((
        acc: number, { listedPrice }: { listedPrice:number }
      ) => acc + listedPrice, 0));
      const totalUnlistedPrice = Math.round(listedVsUnlistedByDays.reduce((
        acc: number, { unlistedPrice }: { unlistedPrice:number }
      ) => acc + unlistedPrice, 0));

      res.json({
        apartsByDays,
        totalAparts,
        listedVsUnlistedByDays,
        apartsCountsByRooms,
        topCountries,
        totalSquareMeters: totalSquare.totalSquare,
        totalListedPrice,
        totalUnlistedPrice,
        listedVsUnlistedPriceByDays,
      });
      }
    )
  )
);
Install and import Zod before using this pattern: pnpm add zod or npm install zod, then import * as z from 'zod';. admin.express.withSchema(...) will convert the Zod schema to OpenAPI for you.
If you created the app with the CLI defaults, start it and open http://localhost:3500/api-docs in your browser to see this custom method in the generated API docs.
☝️ Please note that we are using
admin.express.authorizemiddleware to check if the user is logged in. If you want to make this endpoint public, you can remove this middleware. If user is not logged in, the request will return 401 Unauthorized status code, and protect our statistics from leak.
☝️ Moreover if you wrap your endpoint with
admin.express.authorizemiddleware, you can accessreq.adminUserobject in your endpoint to get the current user information.
☝️ Using
admin.express.withSchema(...)is the recommended approach because it adds your route to/api/v1/openapi.jsonand/api-docs(Solar), performs early runtime validation for API calls, and gives agent plugins a machine-readable API contract they can use in skills. It is still optional though, and you can register plain Express routes withoutwithSchema(...)if you prefer.
☝️ If you do not want to use Zod, you can pass a plain JSON Schema (or convert it from e.g. typebox) object instead of a Zod schema. For example, this Zod response schema:
response: z.object({
  apartsByDays: z.array(z.record(z.string(), z.unknown())),
  totalAparts: z.number(),
}).catchall(z.unknown()),
can be written as pure JSON Schema:
response: {
  type: 'object',
  properties: {
    apartsByDays: {
      type: 'array',
      items: {
        type: 'object',
        additionalProperties: true,
      },
    },
    totalAparts: {
      type: 'number',
    },
  },
  required: ['apartsByDays', 'totalAparts'],
  additionalProperties: true,
},
☝️ AdminForth does provide own data access facility called DATA API to access data in database. But it is very basic and mostly covers only simple CRUD operations. For complex queries like in this example, it is better to use your own data access code with any ORM. You are free to use any ORM like Prisma, TypeORM, Sequelize, mongoose, or just use raw SQL queries against your tables.
Demo:
Custom pages without menu item
Sometimes you might need to add custom page but don't want to add it to the menu.
In this case you can add custom page using customization.customPages option:
new AdminForth({
  // ...
  customization: {
    customPages: [
      {
        path: '/setup2fa', // route path
        component: {
          file: '@@/pages/TwoFactorsSetup.vue',
          meta: {
            title: 'Setup 2FA',  // meta title for this page
            sidebarAndHeader: 'none'  // Layout options: 'none' (no sidebar/header), 'default' (full layout), 'preferIconOnly' (collapsed sidebar)
          }
        }
      }
    ]
  }
})
💡 Layout Options Explained:
'none': Renders the page without AdminForth's default sidebar and header layout - perfect for standalone pages like setup wizards, or public (logged-out) pages (Terms-of-Service/PP/Contact form etc)'default': Uses the full AdminForth layout with sidebar and header - ideal for pages that should feel integrated with the admin panel'preferIconOnly': Uses the default layout but starts with a collapsed sidebar (even if icon-only sidebar is disabled in your configuration) - great for pages that need more screen space or already have some navigation
This will register custom page with path /setup2fa and will not include it in the menu.
You can navigate user to this page using any router link, e.g.:
<template>
  <Link to="/setup2fa">Setup 2FA</Link>
</template>
Add to your <script setup> section:
import { Link } from '@/afcl';
If you set sidebarAndHeader: 'none' in the meta object, it will not include default layout like sidebar and header, so you can create your own layout for this page.
Disable redirects to login page (Public pages)
Any route which has sidebar and header (e.g. default CRUD pages or menu item with component) uses internal AdminForth REST API to fetch menu items and user information, so it passes authentication check and if authentication cookie is not provided or has expired JWT user gets redirected to the login page.
In case if you set sidebarAndHeader: 'none', it will not call these APIs so user will not be automatically redirected to the login page in case of expired or not-provided authentication cookie. That feature allows you to implement public pages without authentication, e.g. Terms of Service, Privacy Policy and many others. In case if you need to check if user is logged in just call any custom API which has admin.express.authorize middleware. Obviously for public pages if they use any APIs you should create API endpoint WITHOUT admin.express.authorize middleware.
Please note that AdminForth uses classic SPA Vue app, so even public pages will be rendered by JavaScript in the browser and not on the server side. If your public page should be indexed by search engines, you should use some SSR framework like Nuxt.js to create such pages. At the same time public pages can still be usefull if you don't focus on old-fashioned search engines (modern search engines can index SPA pages as well) or if indexing is not important for such pages at all (e.g. Terms of Service, Privacy Policy, Contact Us and many others).
Passing meta attributes to the page
You can add custom meta attributes to the page by passing meta object to the page:
    customPages: [
      {
        path: '/setup2fa', // route path
        component: {
          file: '@@/pages/TwoFactorsSetup.vue',
          meta: {
            title: 'Setup 2FA',  // meta title for this page
            sidebarAndHeader: 'none',   // don't include default layout like menu/header
            myAttribute: 'a1'
          }
        }
      }
    ]
To access passed meta attributes in your page, you can use useRoute hook:
import { useRoute } from 'vue-router';

const route = useRoute();

console.log(route.meta.myAttribute);  // a1
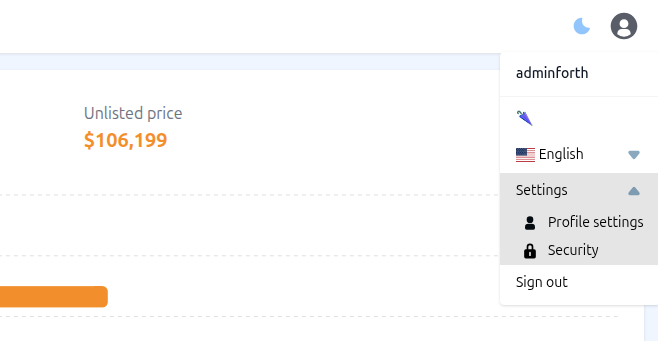
Settings View
If you want to add a Settings section to your project:
export const admin = new AdminForth({
  baseUrl : ADMIN_BASE_URL,
  auth: {
    userMenuSettingsPages: [
      {
        pageLabel: 'Profile settings',
        component: '@@/ProfileSettings.vue',
        // Specify a slug if you want a custom URL path.
        // For example, without a slug, the URL will be:
        //   example.com/settings/profile-settings
        // With a custom slug, you could have:
        //   example.com/settings/users-settings
        slug: "users-settings",
        icon:"flowbite:user-solid"
      },
      {
        pageLabel: 'Security',
        component: "@@/MySecrets.vue",
        icon: "flowbite:lock-solid"
      }
    ],
  }
});
After this, you will have a custom Settings section in the users menu:
Explicit register of components
There might be rare cases, when you need to register component explicitly and then re-use it somewhere else:
  ...

  customization: {
      brandName: "dev-demo",
      title: "dev-demo",
      favicon: '@@/assets/favicon.png',
      brandLogo: '@@/assets/logo.svg',

  ...

  },
  componentsToExplicitRegister: [
    {
      file: '@@/JobCustomComponent.vue',
      meta: {
        label: 'Job Custom Component',
      }
    }
  ],
and then you can re-use this component like:
  import { getCustomComponent } from '@/utils';

  ...
    <component
      :is="getCustomComponent('@@/JobCustomComponent.vue')"
    />